Overview
Four models at the cost tier a high-volume pipeline would actually run on (GPT-4o-mini, Gemini-3-Flash, DeepSeek-V3, GLM-4.7) were each given 120 demographic cohorts under two framings, one written the way a clinician enters a patient and one the way a person describes themselves. All 28,800 responses were scored against survey-weighted PHQ-8 anchors derived here from NHANES public microdata, cycles 2005–2006 through 2017–2018.
The question is whether these models reproduce the distributional properties of a real population, or only the appearance of an individual patient.
The coherence–fidelity dissociation
Case by case the output holds up. Applying a formal DSM-5 gateway rule, under which an elevated total requires depressed mood or anhedonia, 97.3% of elevated presentations pass. The violation rate of 2.68% runs well below a chance null of 10.4%, so the models are holding a floor under the cardinal items rather than benefiting from a lenient rule.
As populations they fail. Every group with a valid benchmark comes back inflated by 2.8 to 5.5 PHQ-8 points, and 18.2% of simulated patients screen at the treatment threshold against 7.5% of adults.
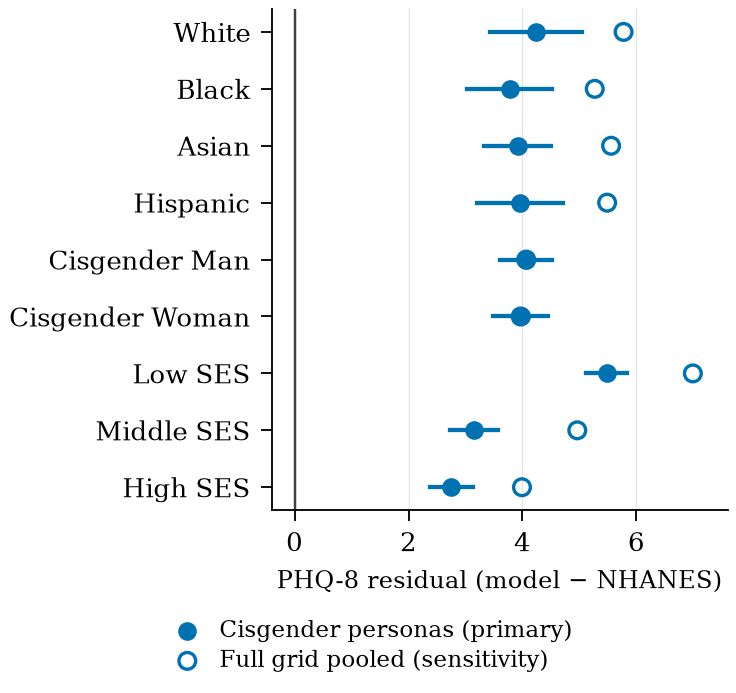 Figure 1: PHQ-8 severity residuals against NHANES weighted anchors. Filled markers are cisgender personas with 95% intervals clustered at the design cell; open markers pool the full persona grid as a sensitivity check.
Disparities that do not survive the simulation
Both contrasts are equivalent to zero within a bound set at the population disparity itself, on 96 matched cell pairs per contrast. The design would have detected a gap the size of the population’s with probability .995.Population data place Black adults 0.330 PHQ-8 points above White adults. These models place them 0.131 below, on an interval covering zero. Hispanic against White runs the same way: a population gap of +0.243 against a simulated −0.034. Two of the four models invert the sign rather than shrinking it.
A demographic-fairness audit run on a synthetic cohort drawn from these models would therefore return a false all-clear on race. The auditor would be reading a property of the generator.
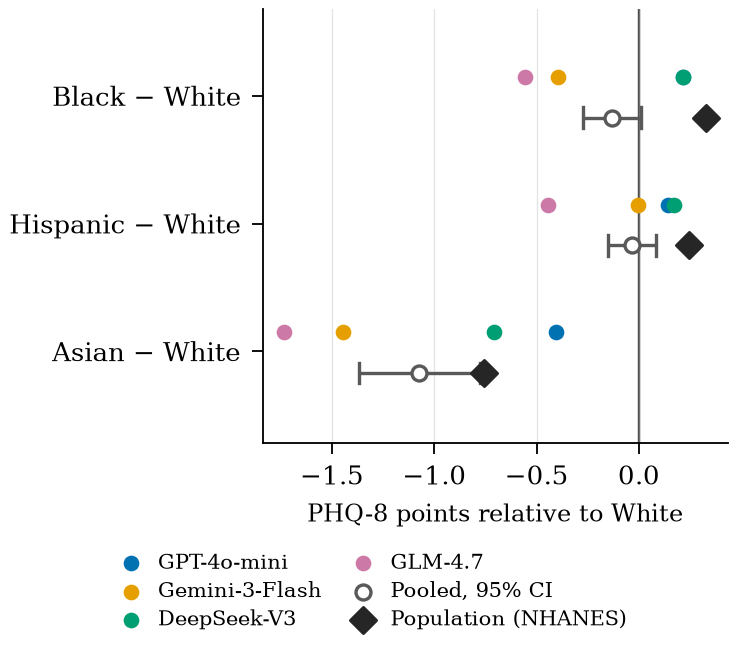 Figure 2: Simulated racial contrasts against population values. On Black and Hispanic the pooled interval covers zero while the population marker sits well outside it. The Asian contrast keeps its direction and is exaggerated.
Key findings
-
The error is differential, not a uniform offset. A calibration correction can absorb an offset. Symptom covariance reorganizes by cohort, so any factor solution fitted to pooled cohorts describes none of them.
-
Offsets do not stack. An additive model fitted on the marginals misses the cells by about 0.4 points in either direction, in a pattern tracking income rather than the count of marked characteristics. A per-axis correction lands wide of the cells it was built to fix.
-
The answer does not hold still. At provider-default decoding, a third of patients change severity category between two draws of one prompt, and 56.0% of those crossings land on the PHQ-8 = 10 line separating watchful waiting from treatment.
-
Coherence and stability belong to models, not to the class. Gateway violations run from 0.35% in DeepSeek-V3 to 6.24% in GLM-4.7, an eighteen-fold spread. Normalising against each model’s own null widens it: three models clear their null by factors of 5 to 34, and GLM-4.7 does not clear its own at all.
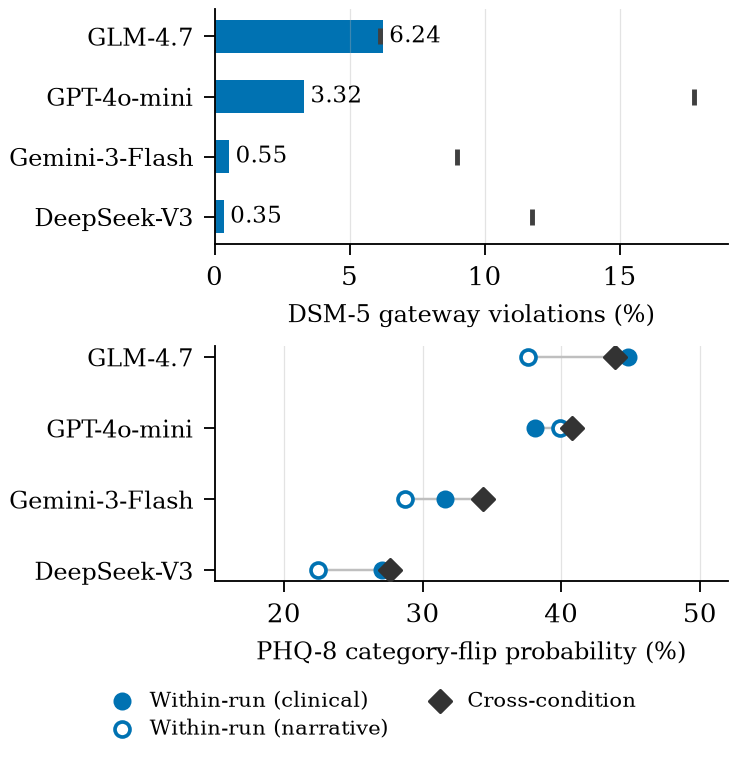 Figure 3: Coherence and stability are model-specific. Top: DSM-5 gateway violation rates among elevated cases against each model’s own conditional-marginal null. Bottom: PHQ-8 category-flip probability per model.
- Setting temperature to 0 is not a portable remedy. A pre-registered control repeated twelve cohorts at temperature 0 across all four endpoints, 2,880 generations. Category flipping falls 35.8 points on GPT-4o-mini and by an amount indistinguishable from zero on GLM-4.7. Where it falls furthest the generation has stopped varying rather than steadied, returning one repeated total in 58 to 75 percent of cells.
Distribution shape
The population distribution is heavily right-skewed, with 77.1% of adults at 4 or below and a long thin tail. The pooled simulated draws put 55.3% into the single five-point band from 5 to 9. Severe scores of 20 or above account for about one adult in 170, and not one of the 14,400 cisgender generations reached that range.
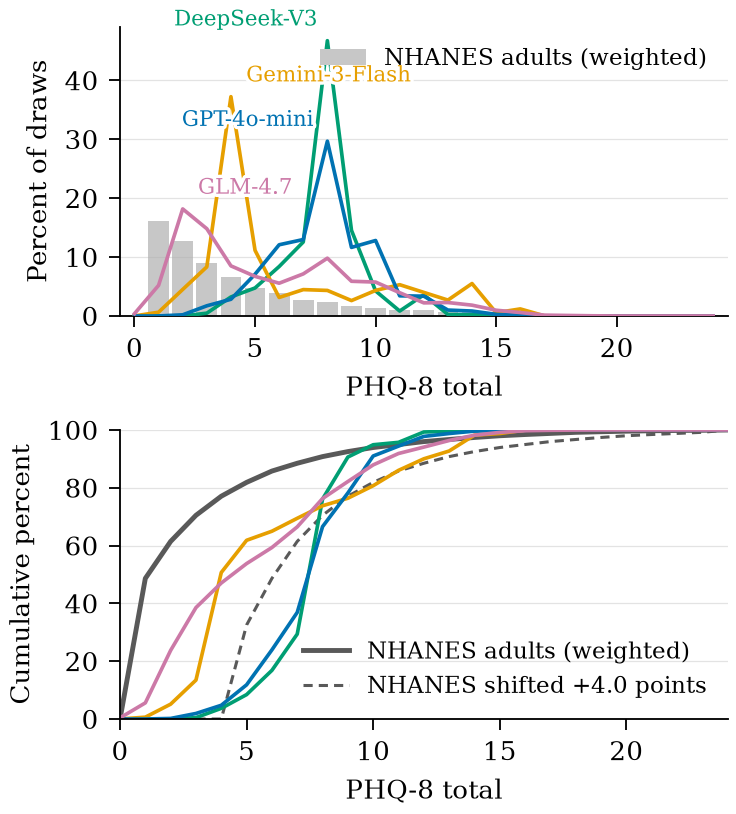 Figure 4: Simulated and population PHQ-8 distributions, cisgender personas. Top: response distributions, NHANES weighted in grey. Bottom: cumulative distributions, with the population also shown shifted upward by the pooled mean residual.
Ground truth, and where it runs out
Depression anchors are computed by the author from NHANES public microdata using MEC examination weights. The pipeline reproduces the descriptive table of Patel et al. (2019) to within 0.02 on every mean and standard deviation but one, and reproduces the national prevalence estimates of Brody et al. (2018) exactly, before it is trusted for new numbers.
Three cells carry no defensible benchmark and are reported without residuals: transgender women, transgender men, and multiracial adults. The reason is a gap upstream of any model. NHIS administered the full PHQ-8 to all 27,651 sample adults in 2022 and fielded experimental gender-identity items in the same year, and no released file carries both. NCHS restricted the section to its Research Data Center, then reported it unavailable there for 2024. The items were discontinued in 2025.
Gender identity carries an extreme on both symptom structure and regeneration stability. It is also the one axis with no instrument left to check it against.
Conclusion
The patients look right. They do not represent real populations.
Read the paper on arXiv · Download the PDF · Data, code and receipts